scipy#
# For interactive plots
from bokeh.plotting import figure, show, output_notebook
from bokeh.models import TeX
output_notebook()
scipy 项目开发的快照。
问题#
query_date = np.datetime64("2020-01-01 00:00:00")

# Load data
with open("devstats-data/scipy_issues.json", "r") as fh:
    issues = [item["node"] for item in json.loads(fh.read())]

glue("devstats-data/scipy_query_date", str(query_date.astype("M8[D]")))
新问题#
显示代码单元格源代码
newly_created = [
    iss for iss in issues if np.datetime64(iss["createdAt"]) > query_date
]
new_issues_closed = [iss for iss in newly_created if iss["state"] == "CLOSED"]

new_issue_lifetime = np.array(
    [
        np.datetime64(iss["closedAt"]) - np.datetime64(iss["createdAt"])
        for iss in new_issues_closed
    ],
).astype("m8[h]")  # in hours

glue("scipy_num_new_issues", len(newly_created))
glue("scipy_num_new_issues_closed", percent_val(len(new_issues_closed), len(newly_created)))
glue("scipy_new_issue_median_lifetime", f"{np.median(new_issue_lifetime)}")
1901 个新问题已自 2020-01-01 以来打开,其中 1185 (62%) 已关闭。
在此期间创建和关闭的新问题的平均生命周期为 92 小时。
query_date = np.datetime64("2020-01-01 00:00:00")

# Load data
with open("devstats-data/scipy_issues.json", "r") as fh:
    issues = [item["node"] for item in json.loads(fh.read())]

glue("scipy_query_date", str(query_date.astype("M8[D]")))
显示代码单元格源代码
title = (
    f"Lifetime of issues created and closed in the last "
    f"{(np.datetime64(datetime.datetime.now()) - query_date).astype('m8[D]')}"
)
h, bedges = np.histogram(
    new_issue_lifetime.astype("m8[D]").astype(int), bins=np.arange(30)
)

p = figure(
    width=670,
    height=400,
    title=title,
    tooltips=[("lifetime", "@right days"), (r"# issues", "@top")],
)
p.quad(top=h, bottom=0, left=bedges[:-1], right=bedges[1:])
p.xaxis.axis_label = "Issue lifetime (days)"
p.yaxis.axis_label = "# Issues"
show(p)
响应时间#
显示代码单元格源代码
# Remove issues that are less than a day old for the following analysis
newly_created_day_old = [
    iss for iss in newly_created
    if np.datetime64(datetime.datetime.now()) - np.datetime64(iss["createdAt"])
    > np.timedelta64(1, "D")
]

# TODO: really need pandas here
commented_issues = [
    iss for iss in newly_created_day_old
    if any(
        e["node"]["__typename"] == "IssueComment" for e in iss["timelineItems"]["edges"]
    )
]
first_commenters, time_to_first_comment = [], []
for iss in commented_issues:
    for e in iss["timelineItems"]["edges"]:
        if e["node"]["__typename"] == "IssueComment":
            try:
                user = e["node"]["author"]["login"]
            except TypeError as err:
                # This can happen e.g. when a user deletes their GH acct
                user = "UNKNOWN"
            first_commenters.append(user)
            dt = np.datetime64(e["node"]["createdAt"]) - np.datetime64(iss["createdAt"])
            time_to_first_comment.append(dt.astype("m8[m]"))
            break  # Only want the first commenter
time_to_first_comment = np.array(time_to_first_comment)  # in minutes

median_time_til_first_response = np.median(time_to_first_comment.astype(int) / 60)

cutoffs = [
    np.timedelta64(1, "h"),
    np.timedelta64(12, "h"),
    np.timedelta64(24, "h"),
    np.timedelta64(3, "D"),
    np.timedelta64(7, "D"),
    np.timedelta64(14, "D"),
]
num_issues_commented_by_cutoff = np.array(
    [
        np.sum(time_to_first_comment < cutoff) for cutoff in cutoffs
    ]
)

# TODO: Update IssueComment query to include:
#  - whether the commenter is a maintainer
#  - datetime of comment
# This will allow analysis of what fraction of issues are addressed by
# maintainers vs. non-maintainer, and the distribution of how long an issue
# usually sits before it's at least commented on

glue(
    "scipy_num_new_issues_responded",
    percent_val(len(commented_issues), len(newly_created_day_old))
)

glue("scipy_new_issues_at_least_1_day_old", len(newly_created_day_old))
glue("scipy_median_response_time", f"{median_time_til_first_response:1.0f}")
在至少 24 小时前的 1901 个问题中,1621 (85%) 的问题已被评论。问题首次得到回复的平均时间为 3 小时。
显示代码单元格源代码
from bokeh.transform import dodge

title = f"Percentage of issues opened since {query_date} that are commented on within..."

x = [str(c) for c in cutoffs]
y = 100 * num_issues_commented_by_cutoff / len(newly_created_day_old)

p = figure(
    x_range=x,
    y_range=(0, 100),
    width=670,
    height=400,
    title=title,
    tooltips=[(r"%", "@top")],
)
p.vbar(x=x, top=y, width=0.8)
p.xaxis.axis_label = "Time interval"
p.yaxis.axis_label = "Percentage of issues commented on within interval"
show(p)
首位回复者#
显示代码单元格源代码
first_commenter_tab = pd.DataFrame(
    {
        k: v
        for k, v in zip(
            ("Contributor", "# of times commented first"),
            np.unique(first_commenters, return_counts=True),
        )
    }
)
first_commenter_tab.sort_values(
    "# of times commented first", ascending=False
).head(10)
| 贡献者 | 首次评论次数 | |
|---|---|---|
| 282 | tupui | 173 |
| 150 | ilayn | 160 |
| 244 | rgommers | 146 |
| 202 | mdhaber | 140 |
| 82 | andyfaff | 88 |
| 70 | WarrenWeckesser | 62 |
| 245 | rkern | 57 |
| 283 | tylerjereddy | 53 |
| 129 | ev-br | 48 |
| 235 | pv | 36 |
拉取请求#
显示代码单元格源代码
with open("devstats-data/scipy_prs.json", "r") as fh:
    prs = [item["node"] for item in json.loads(fh.read())]

# Filters

# The following filters are applied to the PRs for the following analysis:
#
# - Only PRs to the default development branch (e.g `main`)[^master_to_main]
#  are considered.
# - Only PRs from users with _active_ GitHub accounts are considered. For example,
#   if a user opened a Pull Request in 2016, but then deleted their GitHub account
#   in 2017, then this PR is excluded from the analysis.
# - PRs opened by dependabot are excluded.

# Only look at PRs to the main development branch - ignore backports,
# gh-pages, etc.
default_branches = {"main", "master"}  # Account for default branch update
prs = [pr for pr in prs if pr["baseRefName"] in default_branches]

# Drop data where PR author is unknown (e.g. github account no longer exists)
prs = [pr for pr in prs if pr["author"]]  # Failed author query results in None

# Filter out PRs by bots
bot_filter = {
  "dependabot-preview",
  "github-actions",
  "meeseeksmachine",
  "pre-commit-ci[bot]"
}
prs = [pr for pr in prs if pr["author"]["login"] not in bot_filter]
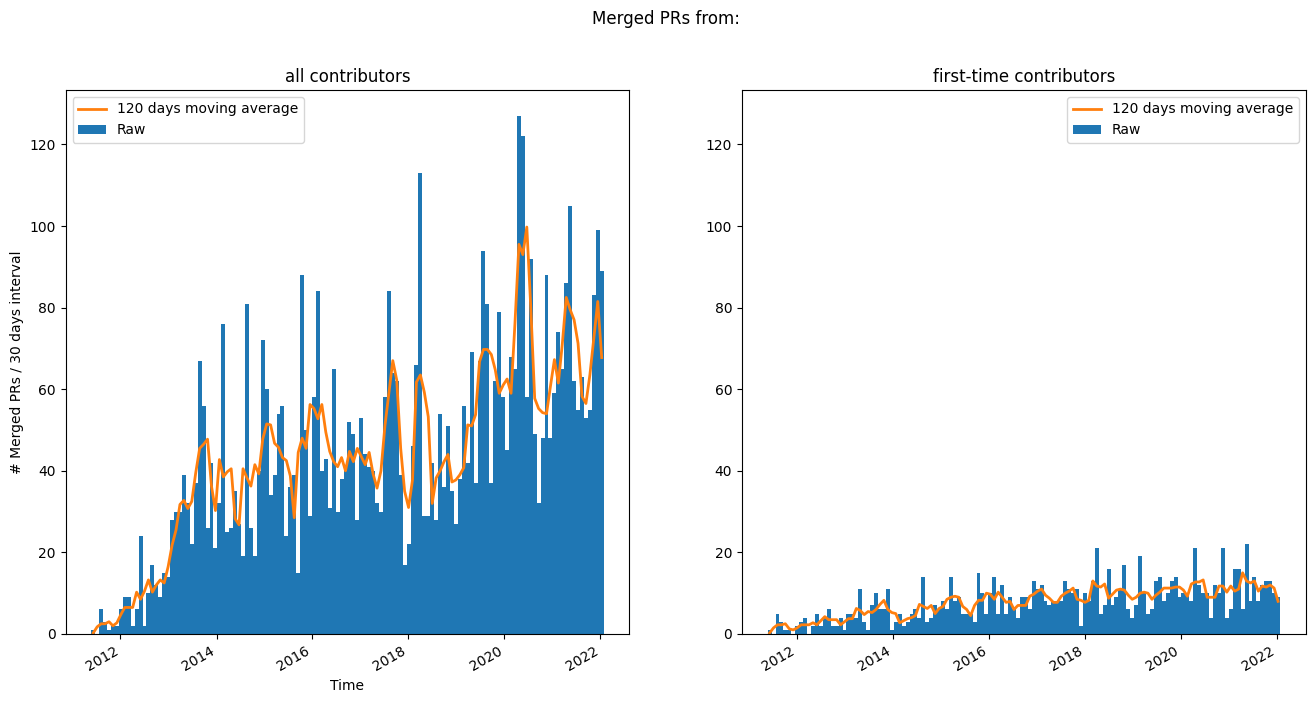
合并的 PR 随时间推移#
查看合并的 PR 随时间推移的情况。
显示代码单元格源代码
# All contributors
merged_prs = [pr for pr in prs if pr['state'] == 'MERGED']
merge_dates = np.array([pr['mergedAt'] for pr in merged_prs], dtype=np.datetime64)
binsize = np.timedelta64(30, "D")
date_bins = np.arange(merge_dates[0], merge_dates[-1], binsize)
h_all, bedges = np.histogram(merge_dates, date_bins)
bcenters = bedges[:-1] + binsize / 2
smoothing_interval = 4  # in units of bin-width

# First-time contributors
first_time_contributor = []
prev_contrib = set()
for record in merged_prs:
    try:
        author = record['author']['login']
    except TypeError:  # Author no longer has GitHub account
        first_time_contributor.append(None)
        continue
    if author not in prev_contrib:
        first_time_contributor.append(True)
        prev_contrib.add(author)
    else:
        first_time_contributor.append(False)
# Object dtype for handling None
first_time_contributor = np.array(first_time_contributor, dtype=object)
# Focus on first time contributors
ftc_mask = first_time_contributor == True
ftc_dates = merge_dates[ftc_mask]

h_ftc, bedges = np.histogram(ftc_dates, date_bins)

fig, axes = plt.subplots(1, 2, figsize=(16, 8))
for ax, h, whom in zip(
    axes.ravel(), (h_all, h_ftc), ("all contributors", "first-time contributors")
):
    ax.bar(bcenters, h, width=binsize, label="Raw")
    ax.plot(
        bcenters,
        np.convolve(h, np.ones(smoothing_interval), 'same') / smoothing_interval,
        label=f"{binsize * smoothing_interval} moving average",
        color='tab:orange',
        linewidth=2.0,
    )

    ax.set_title(f'{whom}')
    ax.legend()

fig.suptitle("Merged PRs from:")
axes[0].set_xlabel('Time')
axes[0].set_ylabel(f'# Merged PRs / {binsize} interval')
axes[1].set_ylim(axes[0].get_ylim())
fig.autofmt_xdate()

# TODO: Replace this with `glue` once the glue:figure directive supports
# alt-text
import os
os.makedirs("thumbs", exist_ok=True)
plt.savefig("thumbs/scipy.png", bbox_inches="tight")
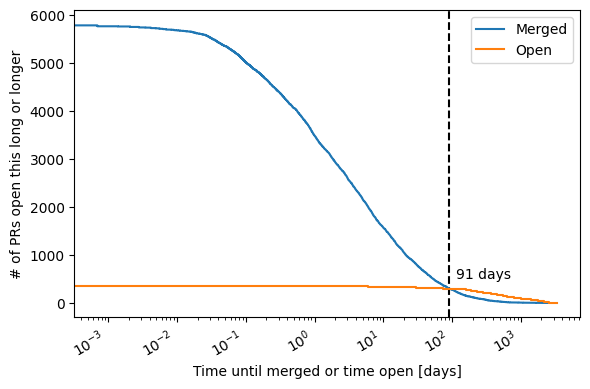
PR 生命周期#
下图显示了 PR 随时间推移的“生存”情况。这意味着,该图显示了有多少 PR 保持打开状态至少这么多天。这被分成已合并的 PR 和仍然打开的 PR(当前不包括已关闭但未合并的 PR)。
显示代码单元格源代码
merged_prs = [pr for pr in prs if pr['state'] == 'MERGED']
lifetimes_merged = np.array(
    [isoparse(pr["mergedAt"]) - isoparse(pr["createdAt"]) for pr in merged_prs],
    dtype="m8[m]").view("int64") / (60 * 24)  # days
lifetimes_merged.sort()

#closed_prs = [pr for pr in prs if pr['state'] == 'CLOSED']
#lifetimes_closed = np.array(
#    [isoparse(pr["mergedAt"]) - isoparse(pr["createdAt"]) for pr in closed_prs],
#    dtype="m8[m]").view("int64") / (60 * 24)  # days
#lifetimes_closed.sort()


# Use the newest issue to guess a time when the data was generated.
# Can this logic be improved?
current_time = isoparse(max(iss["createdAt"] for iss in issues))

open_prs = [pr for pr in prs if pr['state'] == 'OPEN']
age_open = np.array(
    [current_time - isoparse(pr["createdAt"]) for pr in open_prs],
    dtype="m8[m]").view("int64") / (60 * 24)  # days
age_open.sort()

fig, ax = plt.subplots(figsize=(6, 4))
number_merged = np.arange(1, len(lifetimes_merged)+1)[::-1]
ax.step(lifetimes_merged, number_merged, label="Merged")

#ax.step(lifetimes_closed, np.arange(1, len(lifetimes_closed)+1)[::-1])

number_open = np.arange(1, len(age_open)+1)[::-1]
ax.step(age_open, number_open, label="Open")

# Find the first point where closed have a bigger survival than open PRs:
all_lifetimes = np.concatenate([lifetimes_merged, age_open])
all_lifetimes.sort()

number_merged_all_t = np.interp(all_lifetimes, lifetimes_merged, number_merged)
number_open_all_t = np.interp(all_lifetimes, age_open, number_open)

first_idx = np.argmax(number_merged_all_t < number_open_all_t)
first_time = all_lifetimes[first_idx]

ax.vlines(
        [first_time], 0, 1, transform=ax.get_xaxis_transform(), colors='k',
        zorder=0, linestyle="--")

ax.annotate(
    f"{round(first_time)} days",
    xy=(first_time, number_open_all_t[first_idx]),
    xytext=(5, 5), textcoords="offset points",
    va="bottom", ha="left")

ax.legend()
ax.set_xlabel("Time until merged or time open [days]")
ax.set_ylabel(r"# of PRs open this long or longer")
ax.set_xscale("log")
fig.autofmt_xdate()
fig.tight_layout();
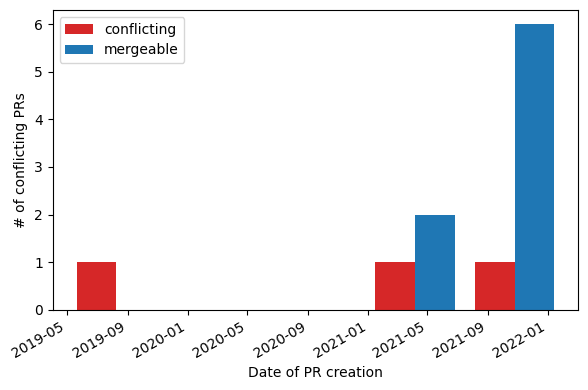
打开的 PR 的可合并性#
显示代码单元格源代码
open_prs = [pr for pr in prs if pr["state"] == "OPEN"]

# The GraphQL query does not reliably return information on PR mergeability.
# Warn if there are problems
if any([pr["mergeable"] == "UNKNOWN" for pr in open_prs]):
    warnings.warn(
        (
            "\n\nThe data contains PRs with unknown merge status.\n"
            "Please re-download the data to get accurate info about PR mergeability."
        ),
        UserWarning,
        stacklevel=2,
    )

conflicting_prs = [isoparse(pr["createdAt"]) for pr in open_prs if pr["mergeable"] == "CONFLICTING"]
mergeable_prs = [isoparse(pr["createdAt"]) for pr in open_prs if pr["mergeable"] == "MERGEABLE"]

fig, ax = plt.subplots(figsize=(6, 4))
ax.hist(
    [conflicting_prs, mergeable_prs],
    bins="auto",
    histtype="bar",
    label=("conflicting", "mergeable"),
    color=("tab:red", "tab:blue"),
)
ax.legend()
ax.set_xlabel("Date of PR creation")
ax.set_ylabel(r"# of conflicting PRs")
fig.autofmt_xdate()
fig.tight_layout();
/opt/buildhome/python3.8/lib/python3.8/site-packages/IPython/core/interactiveshell.py:3508: UserWarning:

The data contains PRs with unknown merge status.
Please re-download the data to get accurate info about PR mergeability.
  exec(code_obj, self.user_global_ns, self.user_ns)
PR 参与者人数#
显示代码单元格源代码
# Get the lifetimes and number of participants for merged PRs
lifetimes = np.array(
    [isoparse(pr["mergedAt"]) - isoparse(pr["createdAt"]) for pr in merged_prs],
    dtype="m8[h]",
)
num_participants = np.array([pr["participants"]["totalCount"] for pr in merged_prs])

title = "Distribution of lifetimes for merged PRs based on the number of participants"

p = figure(width=600, height=300, title=title)
p.xgrid.grid_line_color = None
p.xaxis.ticker = sorted(np.unique(num_participants))
p.yaxis.axis_label = "PR lifetime (hours)"
p.scatter(x=num_participants, y=lifetimes.astype(int), size=9, alpha=0.4)
show(p)
贡献来源#
总共有 5818 个已合并的 PR[1] 由 1036 位唯一作者提交。其中 675 (65%) 是“飞过”PR,即来自仅为该项目贡献过一次(迄今为止)的用户提交的 PR。
显示代码单元格源代码
# Remap PRs by author
contributions_by_author = defaultdict(list)
for pr in merged_prs:
    author = pr["author"]["login"]
    contributions_by_author[author].append(pr)

num_merged_prs_per_author = np.array(
    [len(prs) for prs in contributions_by_author.values()]
)

num_flybys = np.sum(num_merged_prs_per_author == 1)

glue("scipy_num_merged_prs_with_known_authors", len(merged_prs))
glue("scipy_num_unique_authors_of_merged_prs", len(contributions_by_author))
glue("scipy_num_flyby", percent_val(num_flybys, len(num_merged_prs_per_author)))
显示代码单元格源代码
title = "Distribution of number of merged PRs per contributor"

x = ["1", "2", "3", "4", "5", "6 - 10", "10 - 20", "20 - 50", "> 50"]
bedges = np.array([0, 1, 2, 3, 4, 5, 10, 20, 50, sum(num_merged_prs_per_author)]) + 0.5
y, _ = np.histogram(num_merged_prs_per_author, bins=bedges)

p = figure(
    x_range=x,
    y_range=(0, 1.05 * y.max()),
    width=670,
    height=400,
    title=title,
    tooltips=[(r"# PRs merged", "@x"), ("# contributors", f"@top")],
)
p.vbar(x=x, top=y, width=0.8)
p.xaxis.axis_label = "# Merged PRs per user"
p.yaxis.axis_label = "# of unique contributors with N PRs merged"
show(p)
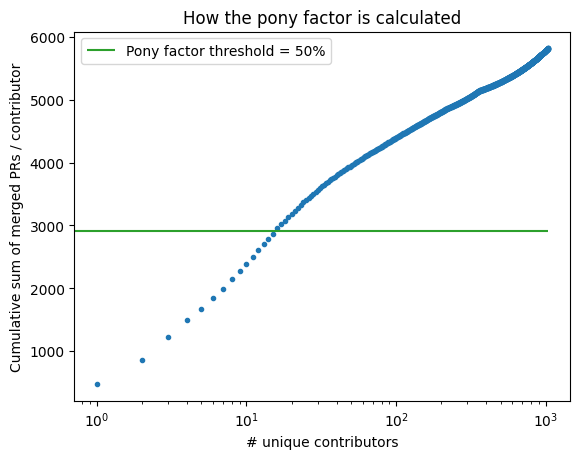
小马因子#
查看这些数据的另一种方法是根据 小马因子,其描述如下:
贡献者中,其总贡献构成大多数贡献的最小人数。
对于此分析,我们将合并的 PR 视为贡献的指标。考虑到项目生命周期内所有合并的 PR,小马因子为:16。
显示代码单元格源代码
# Sort by number of merged PRs in descending order
num_merged_prs_per_author.sort()
num_merged_prs_per_author = num_merged_prs_per_author[::-1]

num_merged_prs = num_merged_prs_per_author.sum()
pf_thresh = 0.5
pony_factor = np.searchsorted(
    np.cumsum(num_merged_prs_per_author), num_merged_prs * pf_thresh
) + 1

fig, ax = plt.subplots()
ax.plot(
    np.arange(len(num_merged_prs_per_author)) + 1,
    np.cumsum(num_merged_prs_per_author),
    "."
)
ax.set_title(f"How the pony factor is calculated")
ax.set_xlabel("# unique contributors")
ax.set_xscale("log")
ax.set_ylabel("Cumulative sum of merged PRs / contributor")
ax.hlines(
    xmin=0,
    xmax=len(contributions_by_author),
    y=num_merged_prs * pf_thresh,
    color="tab:green",
    label=f"Pony factor threshold = {100 * pf_thresh:1.0f}%",
)
ax.legend();

glue("scipy_pony_factor", pony_factor)